The "Status & Monitoring" → "Reporting Service" tab allows you to configure the Axigen mail server logging service including the logging levels and logging types.
SNMP is a networking management protocol used to monitor network-attached devices. SNMP allows messages (called protocol data units) to be sent to various parts of a network. Upon receiving these messages SNMP-compatible devices (called agents) return data specific to certain parameters that are monitored to the SNMP manager.
Listeners and Control Rules
Listeners
To access SNMP listener configuration in WebAdmin, go to the "Status & Monitoring" module → "Reporting Service" tab. A list of the already configured listeners (if any) will be displayed, sorted by their IP addresses (lowest first). To enable / disable any of the existing listeners just click on the corresponding button under Status. To edit / delete any of them, click on the corresponding "Edit" or "Delete" buttons under "Actions".
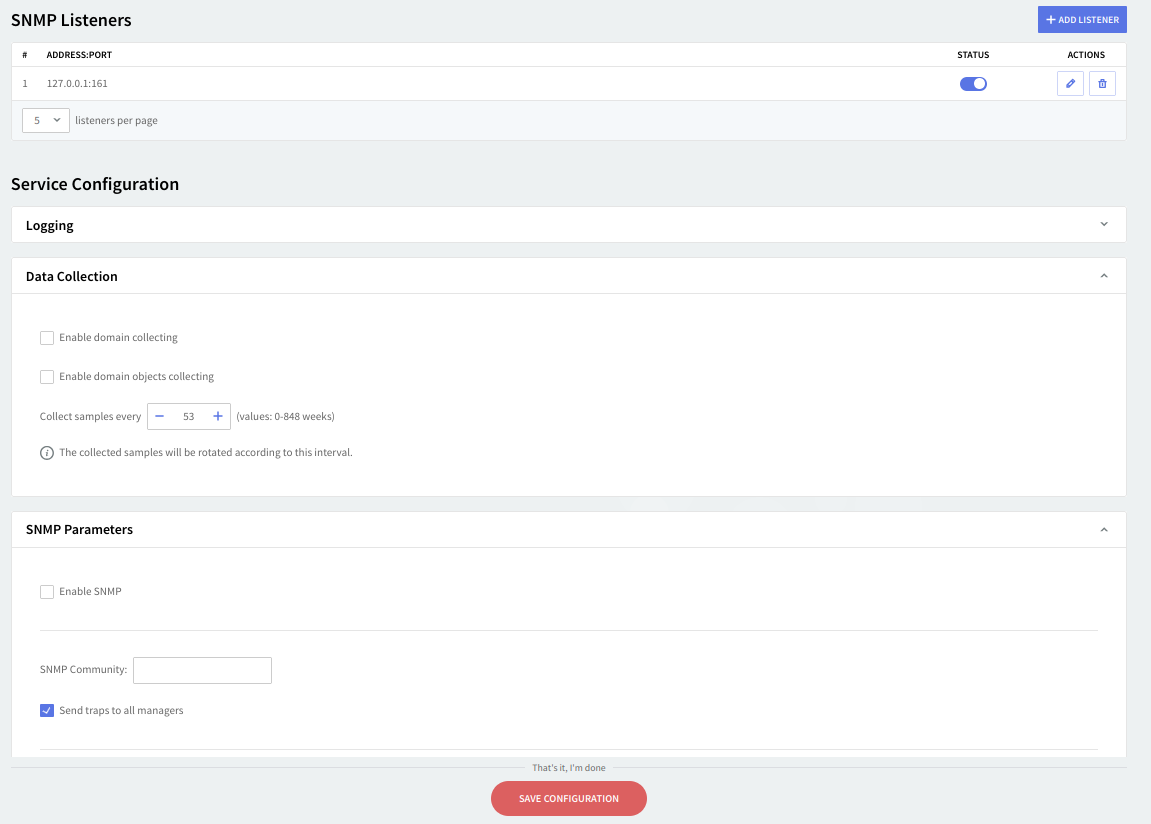
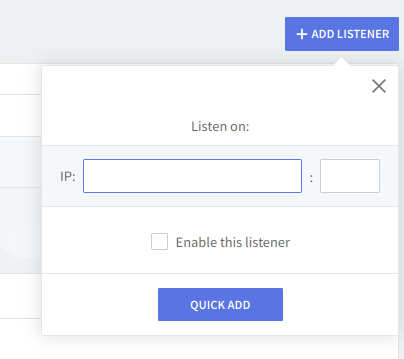
To add a new listener, hit the "Add Listener" button and then fill in the text boxes with the IP address and port details. Should you like the new listener to have the "Enabled" status check the box in front of the "Enable this listener" option. To finalize the addition of the new listener click on "Quick Add".
For a detailed view of listeners usage in Axigen, see the Listeners section.
Service Configuration
Logging

The log level can be set in the "Logging" section with the use of the slider, by moving it to the left or to the right, depending on how detailed the logging information should be. The selected types of messages will change color from transparent to grey. Please note that the log level values are cumulative (i.e. setting the log level to Warning messages will also log "Critical messages" and "Error messages").
Log Types
Use the drop-down menu under Log to select one of the available logging types. You can log (internally, remotely, or using the system log) the activity of all services available in Axigen.
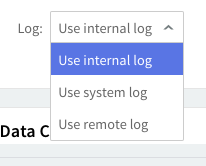
Use remote log option: The Axigen Log service can log internal data coming from other Axigen modules / services or data coming from the UDP port 2000 (default option). Use the drop-down menu to select the custom option if you wish to specify another port.
Data Collection
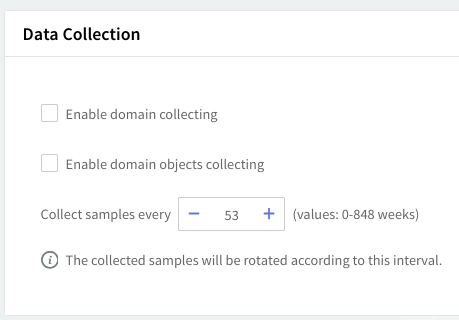
You can "Enable" / "Disable" data collection for domain/domain objects, relevant for the corresponding chart parameters.
If the domain / domain objects data collection options are not enabled, when a chart is created with a "Chart Group" setting for a specific domain / domain object, it will not display any data, because collection for these levels is not enabled.
Use the up and down arrows in order to specify the time interval when the logging information should be collected. The collected samples will be aggregated and stored according to each chart's configuration.
SNMP Parameters
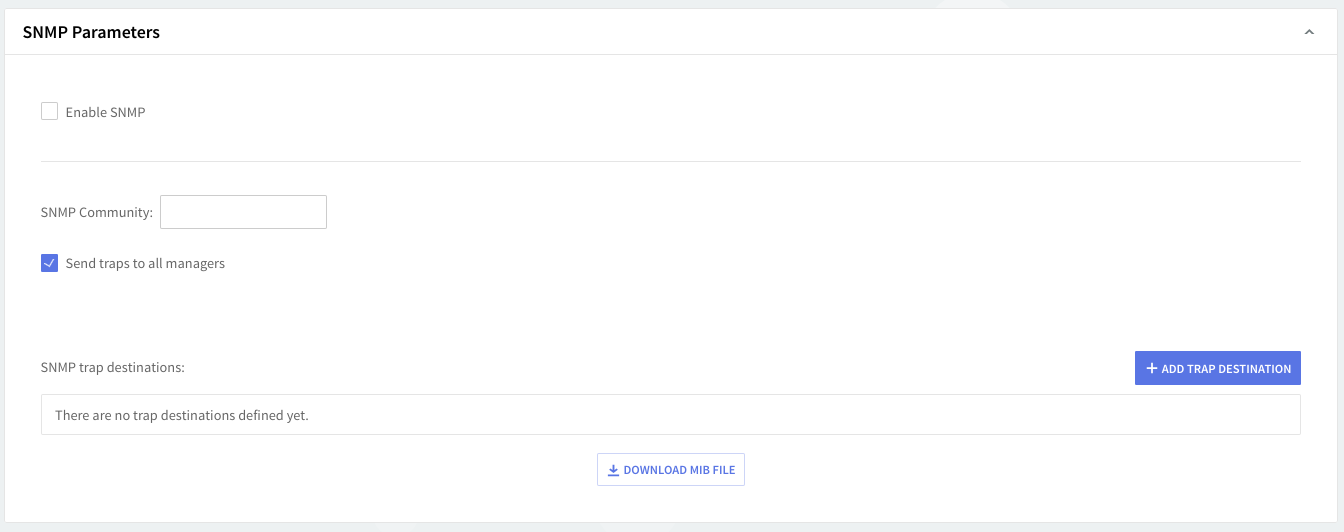
In this section, SNMP can be enabled by checking the box in front of it. Axigen supports SNMP Traps that can be set either for connected managers or specific IPs by checking the "SNMP Send Traps To All Managers" option or defining an SNMP Community and adding IP:Port combinations to it. To add a new trap destination fill in the details in the corresponding text field and click the "Add" button. "Trap Destinations" can be edited directly in the field they are displayed in or deleted by clicking their corresponding "Delete" button.
Download the Axigen MIB file to see all parameters monitored by the reporting service, their description, and other relevant details.
When you are done configuring these parameters, remember to click the "Save Configuration" button to preserve your changes.